Sespros is a statistical framework developed by Eurostat and implemented by all European Union countries. The tool collects public and private social expenditure and tracks social protection expenditure in kind or in cash paid to families or individuals. The system covers all social risks: sickness, disability, old age/survivors, family, employment, housing and poverty/social exclusion. In France, Sespros is supplied by the social protection accounts produced by the DREES.
See Box 3 of the study for more information about the framework.
France is the European country that allocates the largest share of its GDP to social protection benefits
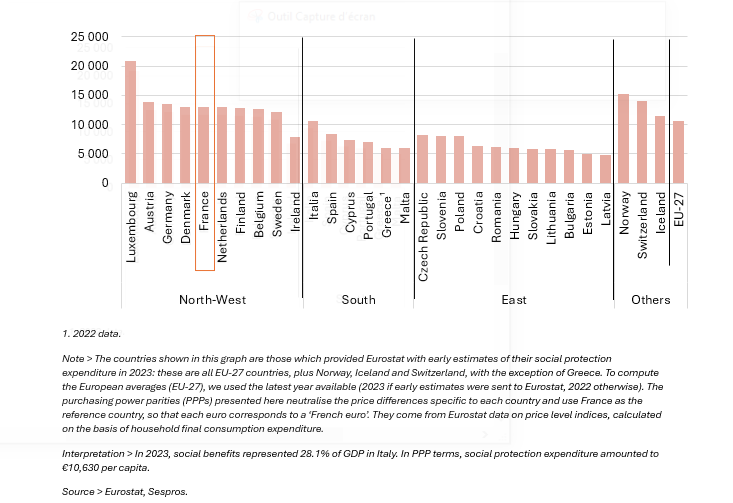
In 2023, spendings on social protection benefits - whether in cash or in kind, all risks combined - average 26.6% of GDP in the EU-27 countries. This amounts to €10,540 per capita in purchasing power parity (PPP) terms. However, the importance of social protection systems varies from one geographical area to another. Northern and Western European countries spend the most on social protection: France allocates 31.5% of its GDP to social protection, the highest share of GDP in Europe; in per capita expenditure, it ranks fifth with 12,960 euros PPP per capita.
Southern European countries occupy an intermediate position, with spending levels ranging from 13.2% of GDP in Malta to 28.1% in Italy, while Eastern European countries allocate much lower amounts to social protection than the rest of Europe, both as a percentage of GDP and in PPP euros per capita.
Figure 1a - Social protection benefits in 2023, as a % of GDP
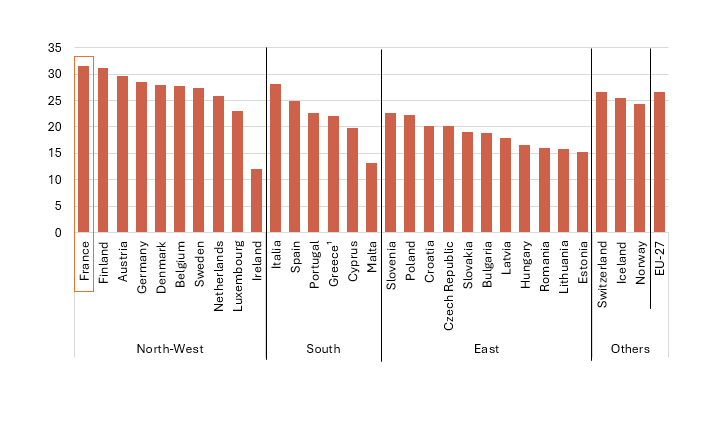
Figure 1b - Social protection benefits in 2023, in euros per capita
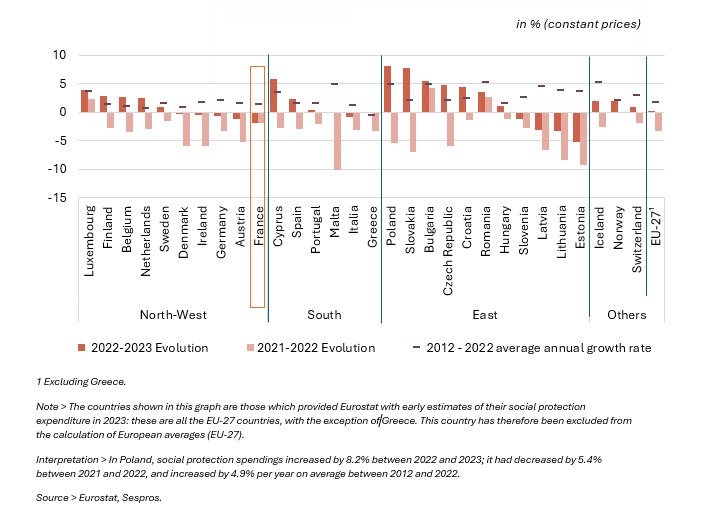
In 2023, social protection spending increase slightly in constant euros in a majority of European countries
The average increase in expenditures in constant euros in the EU‑27 reaches 0.1% in 2023. Fifteen countries in the EU‑27 increased their spendings. Changes are analysed in constant euros to account for the effect of inflation[1], which reached high levels in 2023 (6.0% on average in the EU‑27). This quasi-stability on average follows a fall in spendings of 3.3% in 2022, but remains below the trends observed over the 2012-2022 period, at +1.7% per year on average.
In 2023, the biggest increases in constant euro terms occurred in Poland (+8.2%), Slovakia (+7.8%) and Cyprus (+5.9%), countries where spendings had decreased sharply in 2022. In France, social protection expenditures at constant prices decreased for the second year in a row: ‑1.9% in 2023 after ‑2.0% in 2022 ; by way of comparison, it increased by 1.4% per year on average between 2012 and 2022. In 2023, the decrease in expenditures at constant prices is primarily driven by the sickness risk (3.2%) and the old age and survivors risk (1.0%).
Figure 2 - Changes in social protection benefits between 2012 and 2022, between 2021 and 2022 and between 2022 and 2023
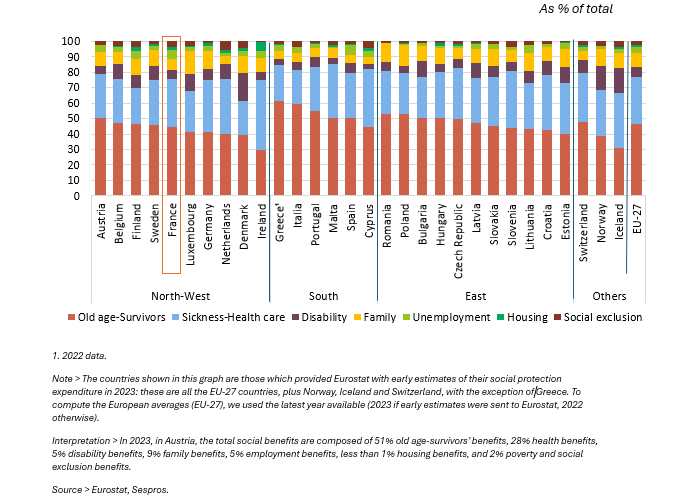
The risks of old age-survivors and sickness-health care are the main areas of social protection expenditure
In 2023, the old age‑survivors risk will be the largest item of social protection expenditure in almost all European countries. These benefits mainly comprise the payment of retirement pensions and represent 47% of all social benefits on average in the EU-27.
Sickness and healthcare is, on average, the second largest item of social benefit expenditure. It represents 30% of total benefits in the EU-27 countries, with variations from country to country: from 22% in Italy and Denmark to 45% in Ireland. This risk accounts for 31% of total benefits in France, slightly higher than the European average. Expenditure on other risks is much lower and varies from country to country. In 2023, in the European Union, spendings on family, disability, employment, housing and poverty/social exclusion risks represent 23% of total benefits (24% in France).
Figure 3 - Structure of social protection benefits by risk in 2023
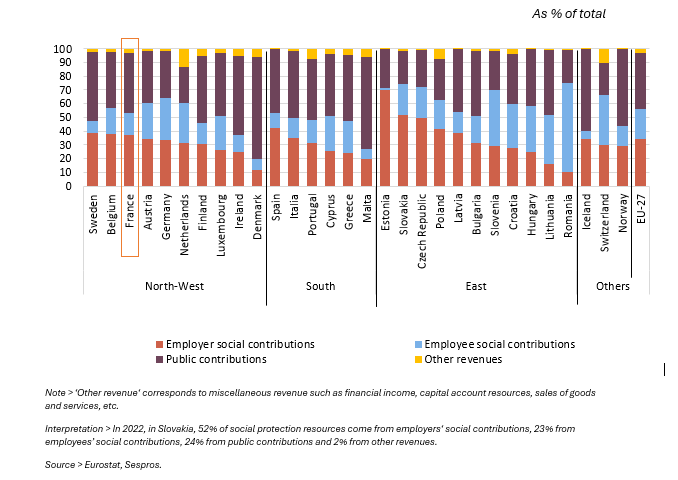
The overall structure of social protection financing is related to the relative importance of the different risks
In Europe, the financing of social protection primarily relies on social contributions based on salaries and on public contributions financed by taxation. The breakdown between these two sources varies from one country to another, reflecting the history and development of each social protection system. Since the 2000s, a similar trend has been observed in almost all European countries: the share of employer contributions is declining in favour of public contributions, in order to limit the rise in labour costs.
In all countries, some risks are more funded by public contributions while others are financed by social contributions. The overall financing structure of social protection is therefore related to the relative shares of the various risks in total expenditure.
Old-age and survivors benefits, the largest item of social protection expenditure, are generally linked to past earnings and financed by social contributions (except in Denmark, where basic public pensions are flat-rate). Employment risk benefits are also financed by social contributions in most countries, with the exception of Denmark and Ireland. On the other hand, housing benefits and poverty and social exclusion benefits, which are based on national solidarity, are generally funded by public contributions. The financing of sickness benefits, the second largest item of social protection expenditure, varies from country to country. It relies mainly on public contributions in Sweden and Denmark, and on social security contributions in Germany, the Netherlands and Poland. In France, the financing of sickness benefits changed in 2018 with the abolition of employee sickness contribution and unemployment contribution, replaced by an increase in the general social contribution (CSG, a public contribution) on a broader income base (including replacement income and assets). Lastly, family risk benefits are often funded by public contributions, except in France and Sweden where funding by social security contributions remains predominant.
Figure 4 - Structure of social protection resources in Europe in 2022